Egaleo 5G
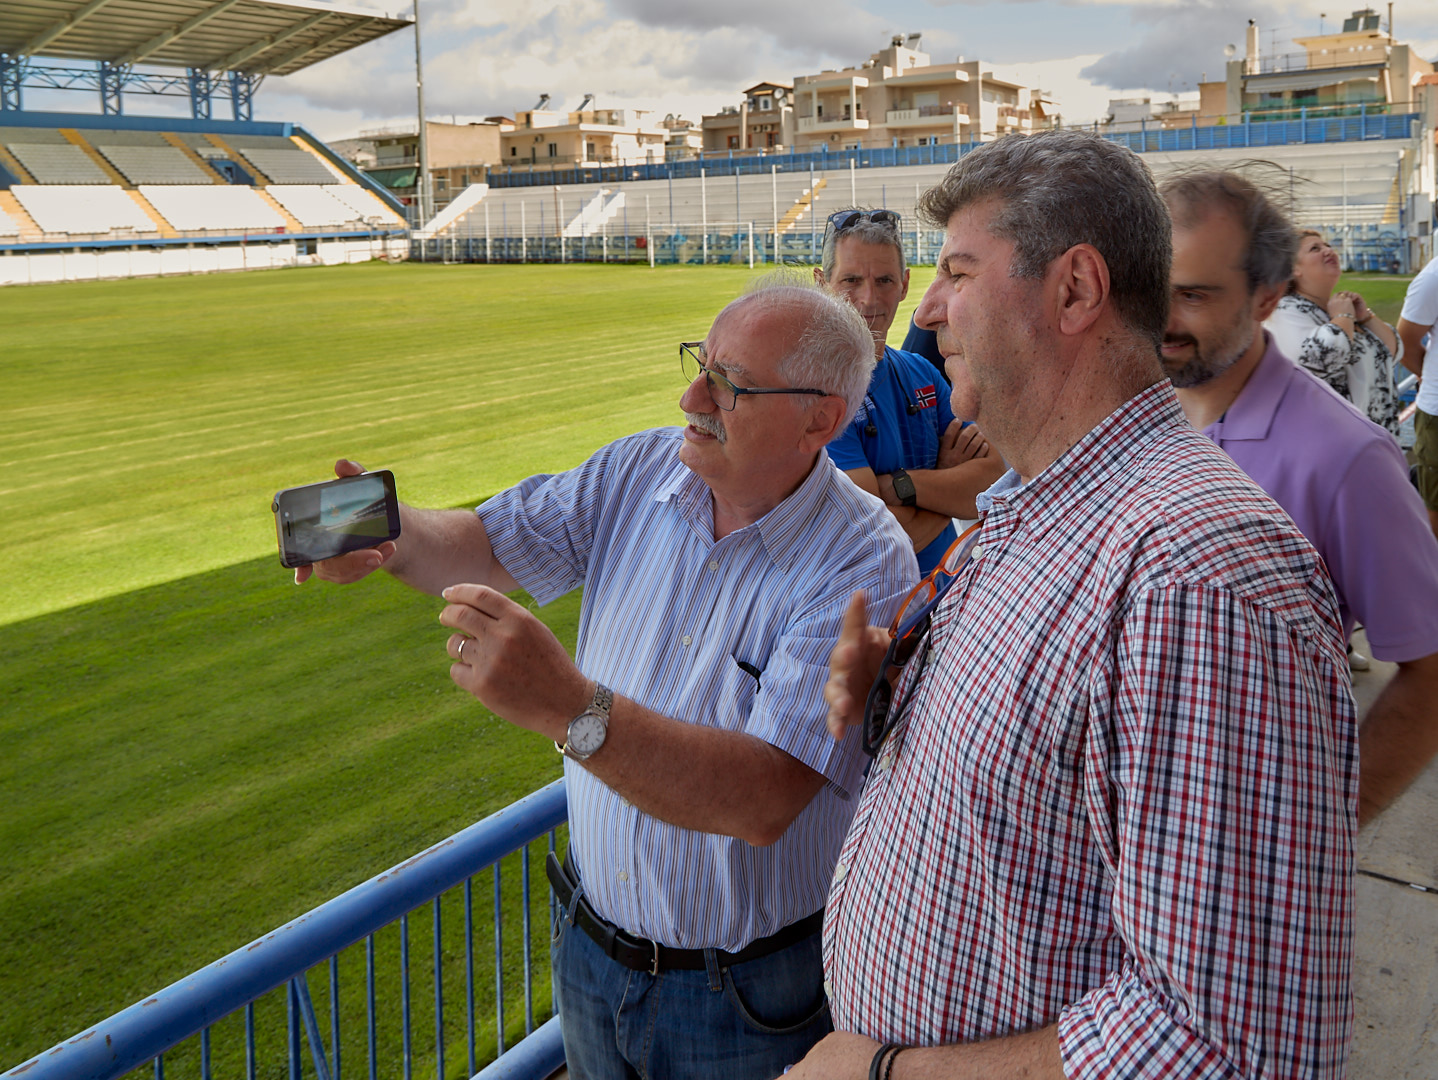
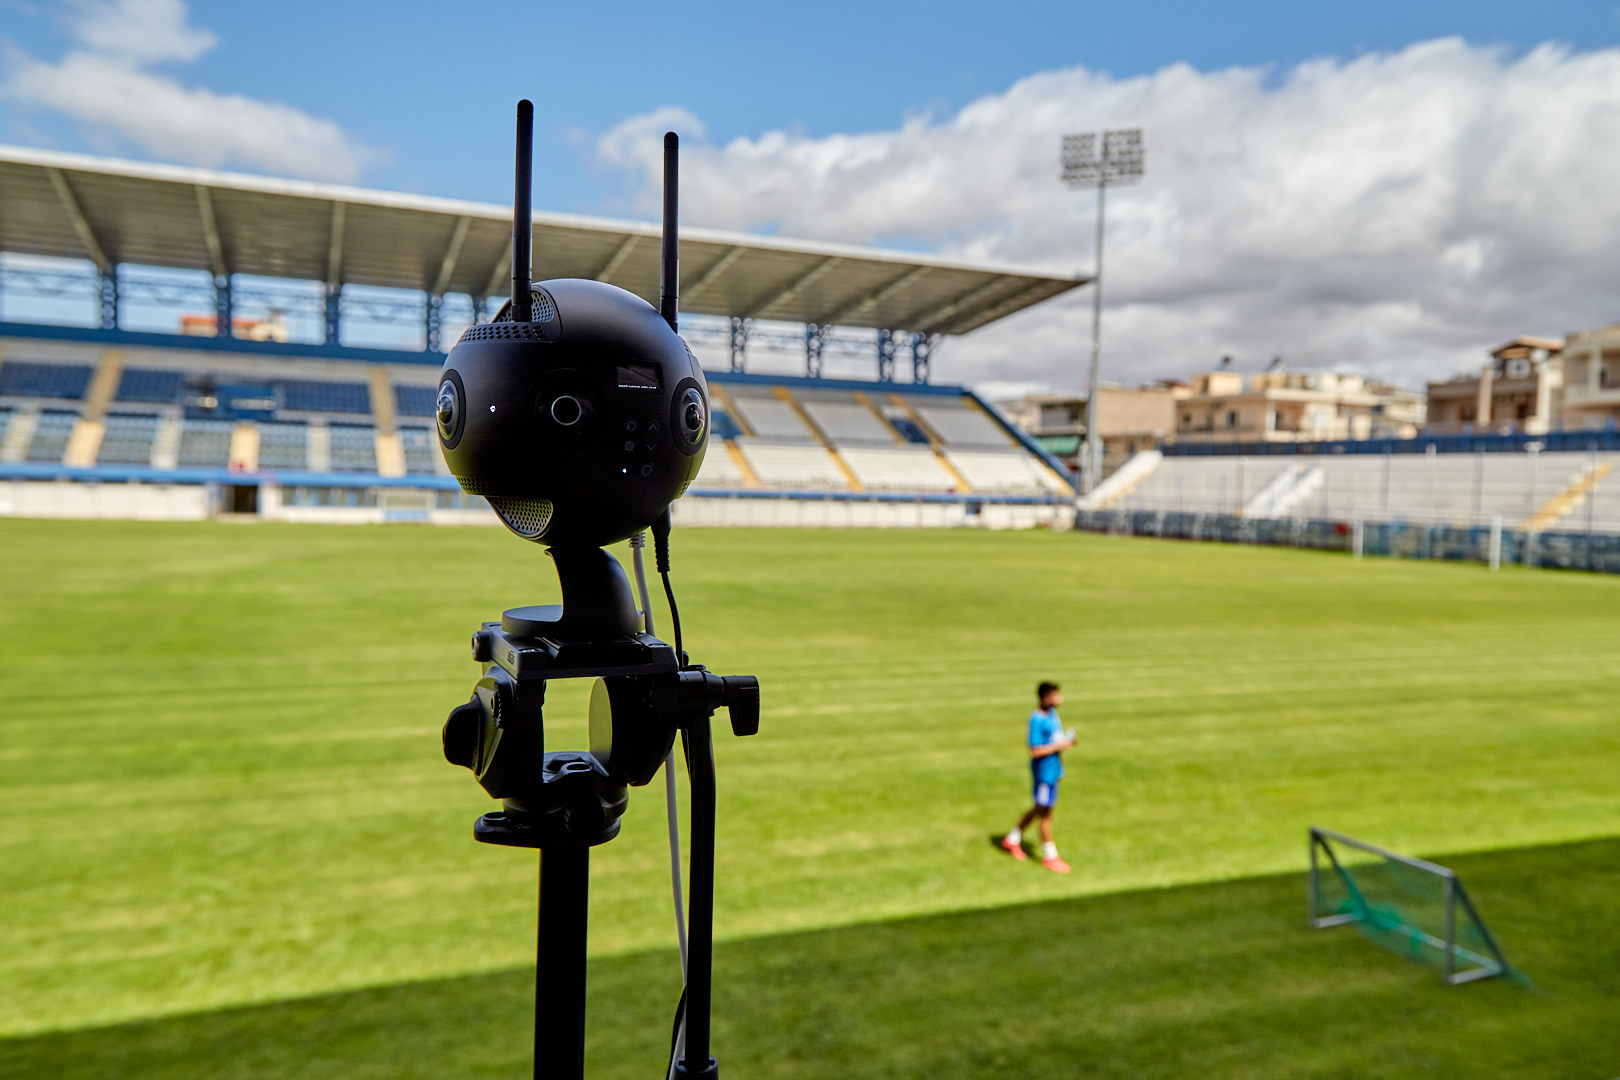
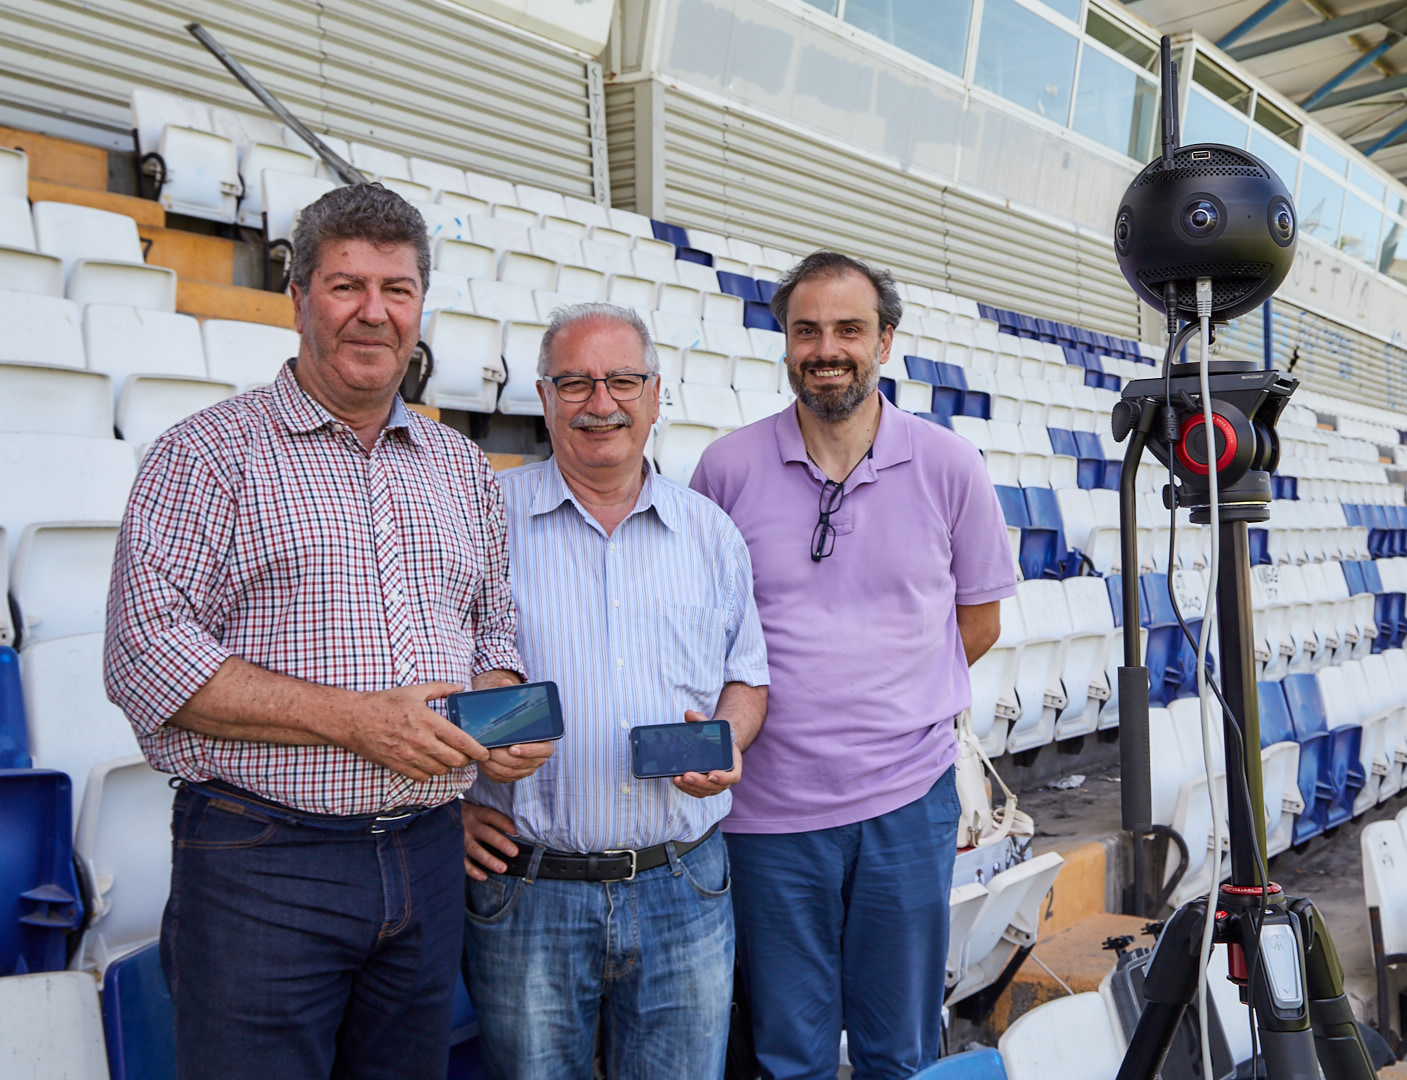
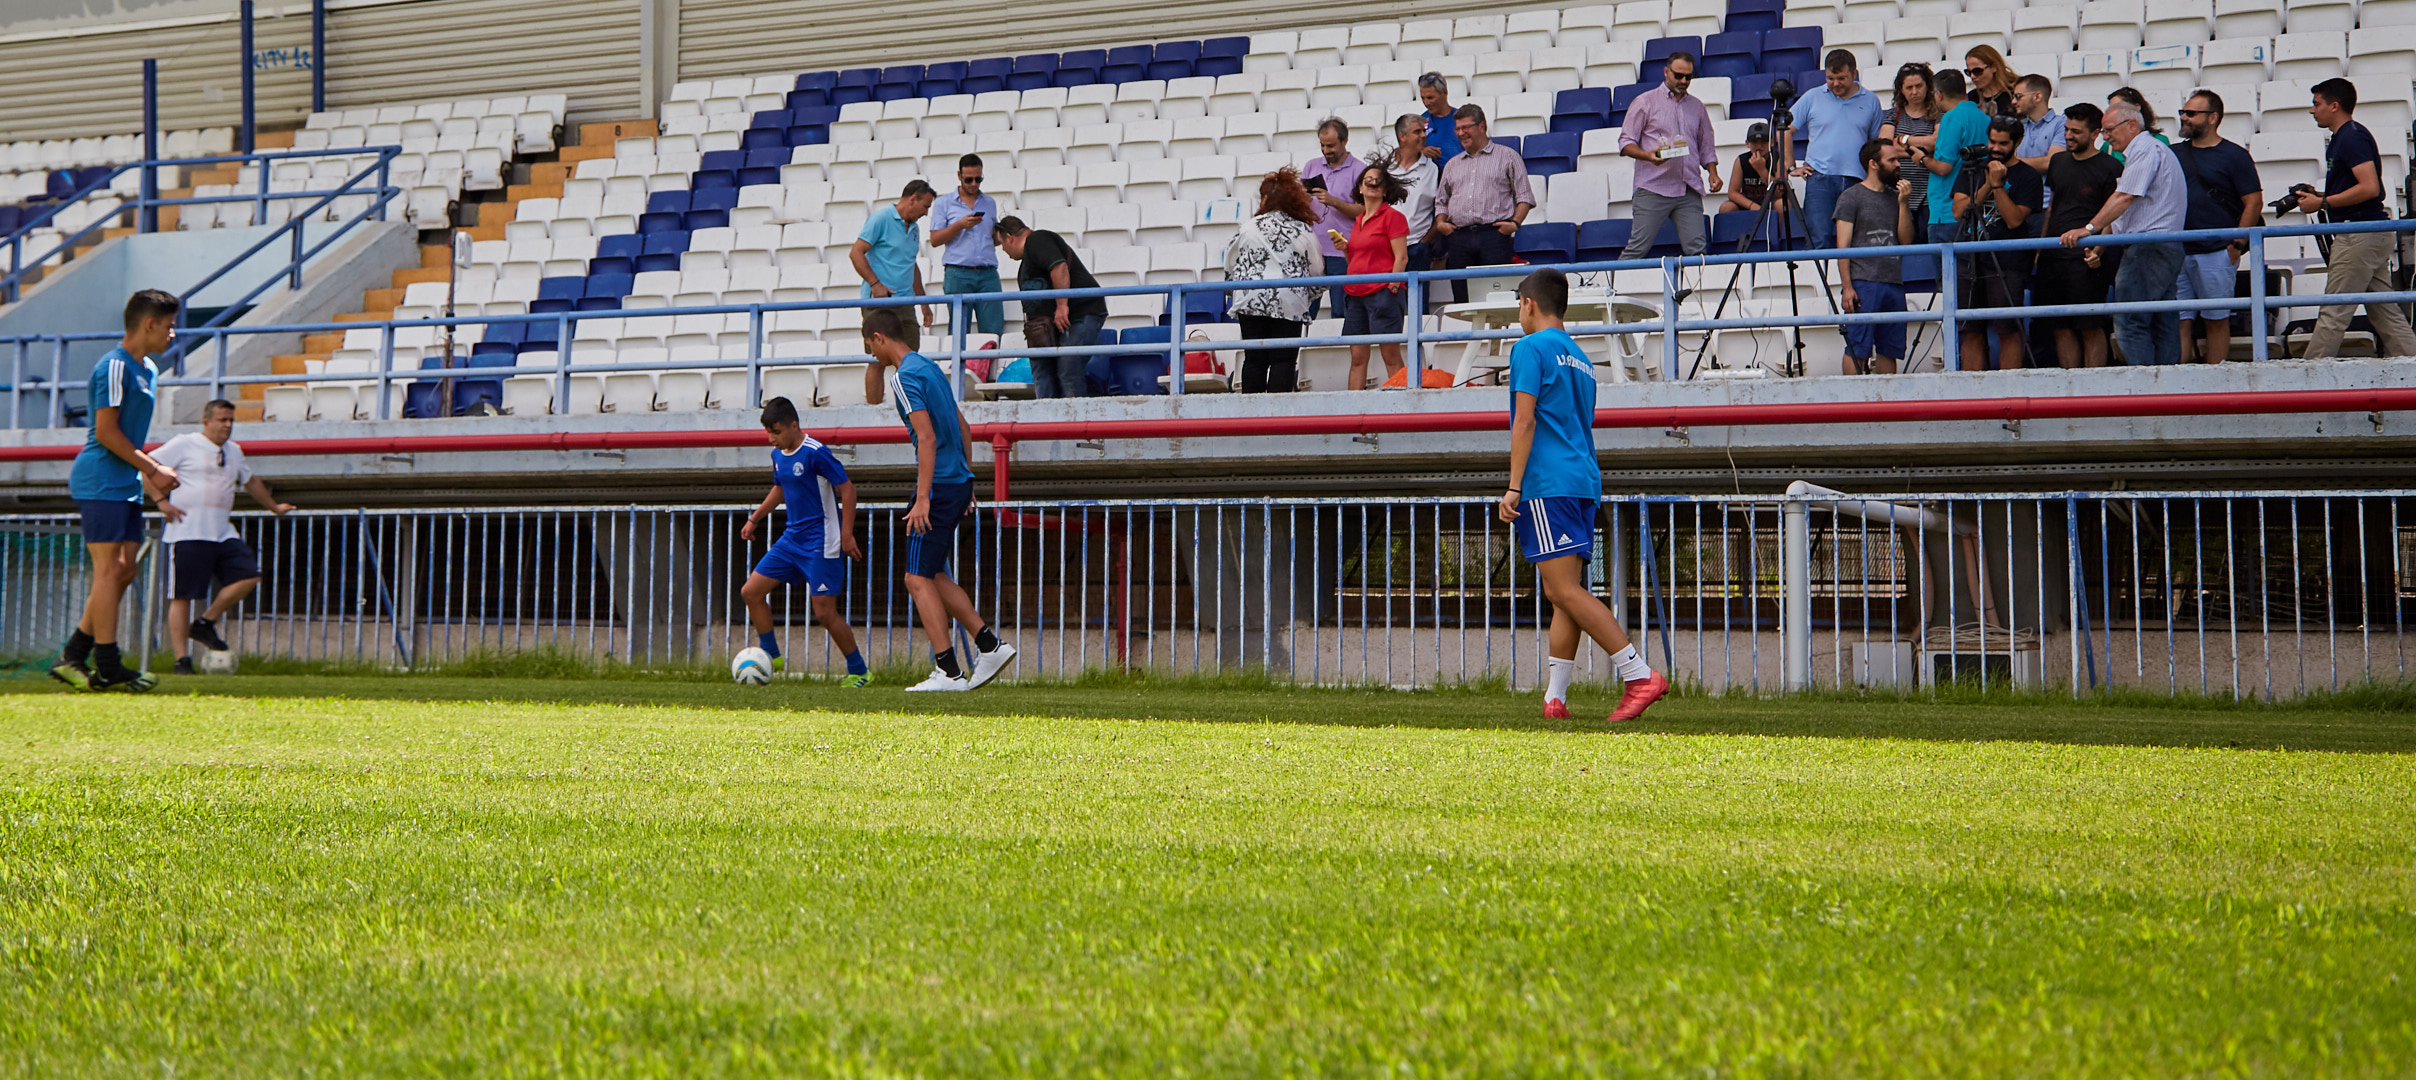
The road to 5G! First live 5G trial of the 5G ESSENCE project at the Egaleo Football stadium, many thanks to Dimitris Tzempelikos for organizing the event, and Ακαδημία Ποδοσφαίρου Α.Ο. Θεμιστοκλής for being the first 5G team!
The road to 5G! First live 5G trial of the 5G ESSENCE project at the Egaleo Football stadium, many thanks to Dimitris Tzempelikos for organizing the event, and Ακαδημία Ποδοσφαίρου Α.Ο. Θεμιστοκλής for being the first 5G team!


Take the “red pill” and let’s dive into monitoring basics with Prometheus.

source: https://www.robustperception.io/keep-it-simple-scrape_interval-id
spoiler:
In the Prometheus configuration there are two places you can configure the scrape interval: a default in the *global* section and then per-*scrape_config* overrides.
So you could decide that normally you want to scrape everything
every 10s, but there’s some key servers that you would like 2s for, and
other key ones that are a little slower so maybe 4s is the right
setting. Then there’s a really slow exporter that needs 1m, and an even
slower one that needs 3m. So sounds like 2s, 4s, 10s, 1m and 3m is the
way to go!
Please don’t.
rate() . The more intervals you have, the more likely that you’ll not get that quite right. In addition working with data with different intervals can be a little tricky, as for example rate()s with different ranges are not comparable.Intervals on the order of single-digit seconds is getting into profiling territory. While a metrics-based system like Prometheus can handle that in certain cases, Prometheus is not a general profiling tool and thus not the most appropriate for the job. Profiling with Prometheus takes some care in design, and is not something you always want to mix in with your general monitoring.
For some problems metrics will not suffice and you will need to incorporate logs, tracing and/or profiling into your debugging. The more instrumentation you have in your code, the easier is to debug as the additional metrics will help you narrow down and correlate issues. For the problems where resolution does matter (e.g. microbursts) it is not guaranteed that metrics will be able to capture the issue, whereas logs should always spot it**.** Metrics are complementary to other types of monitoring and debugging tools, not a replacement. Metrics give you a good view of how things are working at the system and subsystem levels, but don’t cover individual requests or instruction-level timings.
sources: https://www.robustperception.io/how-does-a-prometheus-counter-work
There are four standard types of metric in Prometheus instrumentation:
Example: How does one “count” the requests a system gets per second? There are three common approaches.
rate() function in Prometheus looks at the history of time series over a time period, and calculates how fast it’s increasing per second. This can handle multiple Prometheus servers taking samples, and if a scrape fails you’ll lose resolution but not data as on the next successful scrape the increments haven’t been lost or averaged away.I start with node_network_receive_bytes_total{device="eno1"} where {device="eno1"} is used to filter the many metrics received for different devices and continue by adding irate() to get the actual graph irate(node_network_receive_bytes_total{device="eno1"}[1m]). The 2 spikes shown were caused by 2 iperf tests (default settings 10sec-test).
# 1st iperf
- - - - - - - - - - - - - - - - - - - - - - - - -
[ ID] Interval           Transfer     Bandwidth
[  4]   0.00-10.00  sec   202 MBytes   169 Mbits/sec                  sender
[  4]   0.00-10.00  sec   202 MBytes   169 Mbits/sec                  receiver

# 2nd iperf
[ ID] Interval           Transfer     Bandwidth
[  4]   0.00-10.00  sec   912 MBytes   765 Mbits/sec                  sender
[  4]   0.00-10.00  sec   912 MBytes   765 Mbits/sec                  receiver
click to zoom 🔎
The basic idea:

source: https://www.robustperception.io/irate-graphs-are-better-graphs
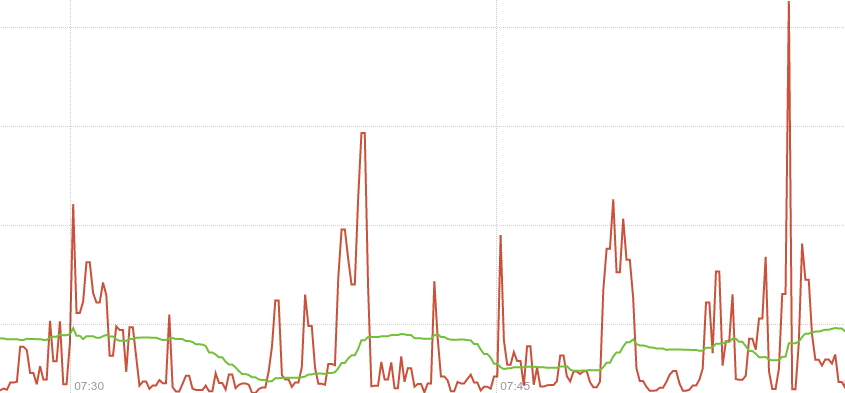
The rate function takes a time series over a time range,
and based on the first and last data points within that range (allowing
for counter resets) calculates a per-second rate. As it’s based on the
whole range, it’s effectively an average rate over that range – 5
minutes in this case. You can see that the green line in the graph above
is slow to pick up on changes, and not showing the full detail.
By contrast irate is an instant rate. It only looks at the last two points within the range passed to it and calculates a per-second rate. In the graph above the scrape interval is 10 seconds, so the red line is allowing you to see much briefer spikes and finer detail. This gives you better insight into what’s really going on, taking advantage of the full resolution of the data available.
Notice the wrong per-second rate calculated in the rate() case (it shows bytes being received for a whole minute! whereas iperf run for only 10 seconds!).
click to zoom 🔎

rate() will automatically handle this. Any time a counter appears to decrease it’ll be treated as though there was a reset to 0 right after the first data point. This makes it important that it not be possible for Counters to be decremented, a Counter that has the potential to be decremented is in reality a Gauge.
As with rate, irate is resilient to scrapes failing as it’ll look back to the previous successful scrape. This loses a little resolution, but you don’t miss any sudden changes around that failed scrape. This is one advantage of exporting raw counters over rates computed on the instrumented system.
Due to the instant rate being more responsive, there are a few things you should be aware of. If you’re doing alerting based on irate a very brief dip could reset the alert’s FOR clause, so prefer rate for alerting. In graphs over long time periods used for trending, full resolution data can be distracting so the implicit averaging of rate is more useful.
from: Understanding Machine CPU usage
Our starting point is a metric exposed by the node-exporter named node_cpu_seconds_total which is of type counter.
This metric comes from /proc/stat and tells us how many seconds each CPU spent doing each type of work:
Notice that there are 8 different types of “CPU-work” counters. k8s-node (the machine used) has an i7 with 8 CPUs, so this means that we will have to calculate the CPU usage by doing some basic math on: 8CPUs x 8types = 64 values
The node has been up for about 4 days, that’s why the time counters (on the left) have reached day levels (especially the idle ones). If we use irate() to calculate the per-second time used (on the right) the results are within the 1 second.
node_cpu_seconds_totalirate(node_cpu_seconds_total[1m])
To treat the different values coming from the 8 different CPUs as one single value, we can use sum().
And because this will end up to values summing up to 8 seconds, we
divide it by 8 (the number of CPUs) to make them sum up to 1 second.
sum by (mode)(irate(node_cpu_seconds_total[1m]))sum by (mode)(irate(node_cpu_seconds_total[1m])) / 8
What happens if a machine has 2, 4… etc CPUs? To make the above more
dynamic (as it is now you have to hard-code the CPU number) we can just
use avg() and result to the same graph.
avg by (mode)(irate(node_cpu_seconds_total[1m]))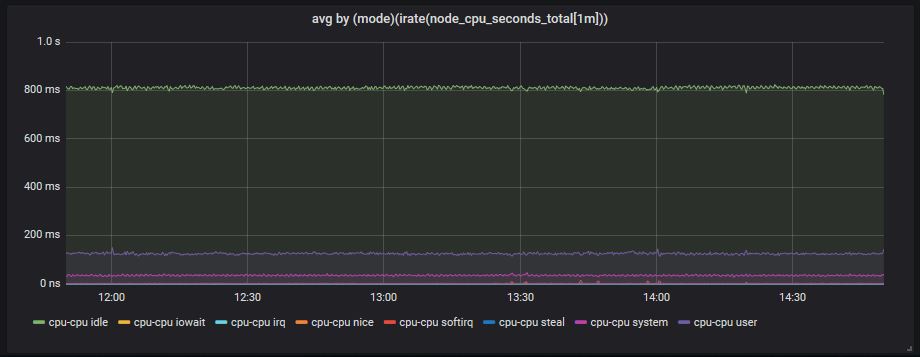
We will use the following logic:
CPU usage = 100 - (idle_time*100) which means that we consider CPU usage everything except the idle time. The prometheus query now becomes:
100 - (avg by (mode)(irate(node_cpu_seconds_total{mode="idle"}[1m]))*100)
and at the end we also change the graph settings from seconds to percentage.
click to zoom 🔎
The same query can be used to show a gauge by changing the graph type and a few parameters. Notice, that “gauge” here doesn’t mean the gauge metric type of prometheus. Our metric is still a counter, we just use some graphana settings to show the current (latest) values and ignore the rest of them.
Command used to generate CPU spikes: stress --cpu 8 --timeout 20
In the previous steps we show everything apart from idle (100%-idle)
but sometimes we need to see what takes most of the CPU usage. Is it the
system, is it the user, is it an iowait
which might indicate a disk/network problem? On the left side is what
we have already used and on the right a slight modification (values sum
up to 1 second):
(avg(irate(node_cpu_seconds_total {mode!="idle"} [1m])) without (cpu))
k8s-master will run:
Docker compose file 👇:
# docker-compose.yml

version: '3'

services:

  prometheus_srv:
    image: prom/prometheus
    container_name: prometheus_server
    hostname: prometheus_server
    restart: always
    volumes:
      - .:/etc/prometheus
    ports:
      - 9090:9090

  grafana:
    image: grafana/grafana
    container_name: grafana
    hostname: grafana
    restart: always
    user: "1000"
    volumes:
      - ./grafana_data:/var/lib/grafana
    depends_on:
      - prometheus_srv
    ports:
      - 3000:3000
scrapping:
k8s-master-IP:9090/metricsk8s-master-IP/metricsk8s-node:9100/metricsk8s-node:8080Prometheus yaml file 👇:
# prometheus.yml

# my global config
global:
  scrape_interval:     10s # By default, scrape targets every 10 seconds.
  evaluation_interval: 10s # By default, scrape targets every 10 seconds.

scrape_configs:
  # Scrape Prometheus itself (k8s-master)
  - job_name: 'prometheus'
    scrape_interval: 10s
    scrape_timeout: 10s
    static_configs:
      - targets: ['localhost:9090']

# Scrape Prometheus (k8s-node)
  - job_name: 'k8s-node'
    scrape_interval: 10s
    scrape_timeout: 10s
    static_configs:
      - targets: ['k8s-node-IP:9100']

 # Scrape Grafana metrics
  - job_name: 'grafana'
    scrape_interval: 10s
    scrape_timeout: 10s
    static_configs:
      - targets: ['k8s-master-IP:3000']

# Scrape cAdvisor metrics (k8s-node)
  - job_name: cadvisor
    scrape_interval: 10s
    static_configs:
      - targets: [k8s-node-IP:8080]
k8s-node will run:
Commands used to run the containers 👇:
#node_exporter

sudo docker run -d \
  --net="host" \
  --pid="host" \
  -v "/:/host:ro,rslave" \
  quay.io/prometheus/node-exporter \
  --path.rootfs /host


# cAdvisor
sudo docker run \
  --volume=/:/rootfs:ro \
  --volume=/var/run:/var/run:ro \
  --volume=/sys:/sys:ro \
  --volume=/var/lib/docker/:/var/lib/docker:ro \
  --volume=/dev/disk/:/dev/disk:ro \
  --publish=8080:8080 \
  --detach=true \
  --name=cadvisor \
  google/cadvisor:latest

SONATA H2020 project, where NCSRD is participating, officially announces the launch of its release 2.0, the third official software release delivered since the project started in July 2015.
SONATA is developing a Network Functions Virtualisation (NFV) service framework that provides a programming model and development tool chain for virtualized services, fully integrated with a DevOps-enabled service platform and orchestration system. SONATA results include:
These SONATA building blocks complement each other in the context of next generation of mobile networks and telecommunication standards referred as 5G, focusing on optimal use of the available network and cloud infrastructure.
SONATA SDK
In this tutorial we will show detailed instructions and debugging info, in order to deploy a DPDK enabled OVS on an Openstack Newton environment, on Ubuntu 16.04.
First and foremost you must have a working Openstack Newton environment with OVS networking.
Secondly you need to have a DPDK enabled OVS, built and running on your system.
The easy way to do that is to just download and configure the official package.
Following these instructions:
https://software.intel.com/en-us/articles/using-open-vswitch-with-dpdk-on-ubuntu
sudo apt-get install openvswitch-switch-dpdk
sudo update-alternatives --set ovs-vswitchd /usr/lib/openvswitch-switch-dpdk/ovs-vswitchd-dpdk
This will install the ovs with dpdk in it. But we also need to add some parameters to the configuration files, and also enable it.
However, before that we need to build DPDK and reserve some hugepages in order to make it run successfully.
The easiest way I have found to do so is, download the DPDK source from dpdk.org, and then run the ./<DPDK-dir>/tools/dpdk-setup.sh
Then select the reserve hugepages option and enter the number. (For us it was 4096 x 2MB hugepages).
Now it is time to configure our OVS files
at the /etc/default/openvswitch-switch, an example configuration would be:
DPDK_OPTS='--dpdk -c 0x3 -n 4 --socket-mem 512 --vhost-owner libvirt-qemu:kvm --vhost-perm 0660'
SIDENOTE: The vhost-perm parameter is very important, as it may lead to a permission denied error in kvm, when binding the port to the VM
So one more thing needs to be configured at the /etc/libvirt/qemu.conf
You need to set:
user = "root"
group = "root"
Then as OVS is running exectute this command:
ovs-vsctl --no-wait set Open_vSwitch . other_config:dpdk-init=true
And then restart the ovs service.
service openvswitch-switch restart.
Check the logs to see the successful execution
You should see something like this at the /var/log/openvswitch/ovs-vswitchd.log:
dpdk|INFO|DPDK Enabled, initializing
dpdk|INFO|No vhost-sock-dir provided - defaulting to /var/run/openvswitch
dpdk|INFO|EAL ARGS: ovs-vswitchd --socket-mem 1024,0 -c 0x00000001
dpdk|INFO|DPDK pdump packet capture enabled
ofproto_dpif|INFO|netdev@ovs-netdev: Datapath supports recirculation
ofproto_dpif|INFO|netdev@ovs-netdev: MPLS label stack length probed as 3
One cause of failure would occur if someone does not reserve sufficient hugepages, or does not fill the configuration files correctly.
From then on, the Openstack part remains to be configured
Now comes the first tricky part. Most guides state that you need to configure the tag [OVS] at the ml2_conf.ini, like this:
[OVS]
datapath_type=netdev
vhostuser_socket_dir=/var/run/openvswitch
what they fail to state is that at the Newton release you need to change the /etc/neutron/plugins/ml2/openvswitch_agent.ini , which overwrites the ml2_conf.ini .
Once OVS is correctly configured with DPDK support, vhost-user interfaces are completely transparent to the guest. However, guests must request large pages. This can be done through flavors. For example:
openstack flavor set m1.large –property hw:mem_page_size=large
At last we are ready to setup and boot a DPDK-port enabled VM.
We can boot it through an already created network, or create a new network.
The proposal of the MediaNet Lab in the first open-call of the SoftFIRE project has been accepted and therefore MediaNet Lab will participate in the first experiments of the SoftFIRE project. SoftFIRE aims at creating an ecosystem of organizations around the technological field of NFV/SDN and and its evolution towards 5G developments. In order to achieve this goal, SoftFIRE plans to aggregate as many as possible organizations and people around an enabling platform. The SoftFIRE platform consists in a federated testbed that comprises very different experimental frameworks and is available for experimenting new services, applications and functional extensions of the platform.
The aim of the MedialNet lab experiments is the development and validation of the necessary extensions to the current SoftFIRE federated testbed, in order to enhance it with the capability to execute experiments involving satellite communication systems.
More details will follow in due time, once the design of the experiment and the expected results have been fully defined.

The First International Workshop on Security in NFV-SDN (SNS2016) in conjunction with the 2nd IEEE NFV-SDN conference, 7-9 November, Palo Alto, California, USA
Workshop website: http://computing.derby.ac.uk/sns2016/
CALL FOR PAPERS
Network Function Virtualization (NFV) and Software Defined Network (SDN) have changed the networking industry dramatically. NFV virtualizes network services by utilizing virtualization technologies to reduce the dependency on underlying hardware. NFV provides many benefits such as faster service enablement, ease of resource management and lower OPEX and CAPEX. SDN separates the control functions from the underlying physical network by decoupling the control and data planes. SDN provides many benefits such as reduced costs, ease of deployment and management, better scalability, availability, flexibility and fine-grain control of traffic and security. Like traditional networks, they are subject to various security threats and attacks. In this workshop, we invite high-quality submissions in the areas of NFV and SDN security and other related areas. Submitted papers should highlight methods and approaches that can be used to analyse the security risks and requirements, threats and techniques related to NFV and SDN and to provide novel methods and approaches to assure security in NFV and SDN.
TOPICS
Topics of interest include but are not limited to the following areas:
• Security, reliability and privacy through SDN and NFV in 5G networks
• Management and orchestration of NFV and SDN elements for security
• Secure design of NFV and SDN solutions, security enablers
• Security threats and vulnerabilities introduced by NFV and SDN technologies
• Threat detection and mitigation through SDN and NFV
• Security policy specification and management in SDN and NFV systems
• Security related monitoring and analytics in SDN and NFV solutions
• 5G security architecture, trust and confidence
• Authentication, authorization and Accounting in SDN
• Security of applying SDN to wireless and mobile network
• Security of applying NFV and SDN to IoT
• Security of applying NFV and SDN to cloud computing
• Security of SDN API
• Risk and compliance issues in SDN
• Securing SDN infrastructure
• Security architecture for SDN
• Security standard of SDN
• Security of SDN data plane
• Security of SDN control plane
• Security of SDN application plane
• Security of Routing in SDN
• Security of network slicing
• Security as a service for SDN
PAPER SUBMISSION
Paper submissions will be handled on-line through the EDAS system at https://edas.info/newPaper.php?c=22175&track=81343
All submitted papers will be peer-reviewed. The manuscripts must be prepared in English, following IEEE two-column Manuscript Templates for Conference Proceedings with a maximum length of six (6) printed pages (10-point font), including figures. You can find the IEEE Computer Society Proceedings Author Guidelines at http://www.computer.org/web/cs-cps/. To be published in the Workshop Proceedings and to be eligible for publication in IEEE Xplore, at least one author of an accepted paper is required to register and present the paper at the workshop. The IEEE reserves the right to exclude a paper from distribution after the conference (including its removal from IEEE Explore) if the paper is not presented at the conference. Papers are reviewed on the basis that they do not contain plagiarized material and have not been submitted to any other conference at the same time (double submission). These matters are taken very seriously and the IEEE Communications Society will take action against any author who engages in either practice. Authors of selected papers will be invited to submit an extended version of their work as a book chapter for Springer book Guide to Security in SDN and NFV – Challenges, Opportunities, and Applications (http://computing.derby.ac.uk/gssnoa2016/).
IMPORTANT DATES
• Paper Submission: July 31, 2016
• Notification of Acceptance: September 7, 2016
• Camera Ready: October 7, 2016
WORKSHOP CHAIRS
• Shao Ying Zhu, University of Derby,UK
• Eleni Trouva, NCSR Demokritos, Greece
• Richard Hill, University of Derby, UK
• Collin Allison, University of St Andrews,UK
• Muhammad Shuaib Siddiqui, Fundació i2CAT, Spain
• Linas Maknavicius, Nokia Bell Labs, France
TECHNICAL PROGRAM COMMITEE
• Sandra Scott-Hayward – Queen’s University Belfast, UK
• Roberto Bifulco – NEC Labs Europe, Germany
• Ludovic Jacquin – Hewlett Packard Labs, UK
• Marco Anisetti – University of Milan, Italy
• Augusto Ciuffoletti – University of Pisa, Italy
• Colin Allison – University of St Andrews, UK
• Rhonda L. Farrell- Booz Allen Hamilton, USA
• Jianxin Li-Beihang University, China
• Ljiljana Trajkovic – Simon Fraser University, Canada
• Eleni Trouva, Harilaos Koumaras, Michail-Alexandros Kourtis – NCSR Demokritos, Greece
• Muhammad Shuaib Siddiqui, Eduard Escalona, Jordi Ferrer, Amaia Legarrea – i2CAT, Spain
• Carolina Canales, Miguel Angel Garcia, Miguel-Angel Monjas, Manuel Lorenzo – Ericsson, Spain
• Felix Klaedtke – NEC Labs Europe, Germany
• Linas Maknavicius, Abdelkader Outtagarts – Nokia, Bell Labs, France
• Nicolae Paladi – SICS, Sweden
• Gergely Biczók – Budapest Univ. of Technology and Economics, Hungary
If you have any question, please contact the organizers:
Shao Ying Zhu – s.y.zhu@derby.ac.uk
Eleni Trouva – trouva@iit.demokritos.gr
Single Root I/O virtualization (SR-IOV) in networking is a very useful and strong feature for virtualized network deployements.
SRIOV is a specification that allows a PCI device, for example a NIC or a Graphic Card, to share access to its resources among various PCI hardware functions:
Physical Function (PF) (meaning the real physical device), from it a number of one or more Virtual Functions (VF) are generated.
Supposedly we have one NIC and we want to share its resources among various Virtual Machines, or in terms of NFV various VNFCs of a VNF.
We can split the PF into numerous VFs and distribute each one to a different VM.
The routing and forwarding of the packets is done through L2 routing where the packets are forwarded to the matching MAC VF.
The purpose of this post is to share a few tips and hacks we came across during our general activities related to SRIOV.
A very good tutorial for SRIOV setup : https://samamusingworld.wordpress.com/2015/01/10/sriov-pci-passthrough-feature-with-openstack/
SRIOV VF Mirroring
Let’s say you want to send the same flows and packets to 2 VMs simultaneously.
if you enter the ip link show you should see something like this:
p2p1: <BROADCAST,MULTICAST,PROMISC,UP,LOWER_UP> mtu 1500 qdisc mq state UP mode DEFAULT group default qlen 1000
link/ether a0:36:9f:68:fc:f4 brd ff:ff:ff:ff:ff:ff
vf 0 MAC 00:00:00:00:00:00, spoof checking on, link-state auto
vf 1 MAC fa:16:3e:c0:d8:11, spoof checking on, link-state auto
vf 2 MAC fa:16:3e:a1:43:57, spoof checking on, link-state auto
vf 3 MAC fa:16:3e:aa:33:59, spoof checking on, link-state auto
In order to perform our mirroring and send all traffic both ways we need to change the MAC address both on the VM and on the VF and disable the spoof check.
Let’s change vf2 -> vf3
On the VM:
ifconfig eth0 down
ifconfig eth0 hw ether fa:16:3e:aa:33:59
ifconfig eth0 up
On the host – VF:
ip link set eth0 down
ip link set eth0 vf 2 mac fa:16:3e:aa:33:59
ip link set eth0 vf 2 spoofchk off
ip link set eth0 up
After that we have 2 VFs with the same MAC.
But it will still do not work. What you have to do is, change again the vf 2 to something resembling the latest MAC
ip link set eth0 vf 2 mac fa:16:3e:aa:33:58
After these changes through the experiments we performed we managed to mirror the traffic on 2 different VFs.
SRIOV Openstack setup with flat networking – no VLAN
In openstack the default setup and various tutorials use the VLAN networking. Meaning the routing is done through MAC and VLAN.
In one of our tests we had trouble creating traffic matching both rules, so we investigated the no VLAN option.
Even though the setup of SRIOV over flat networking in Openstack is pretty simple, we did not find any tutorial, or a note underlining its simplicity.
The steps are pretty straightforward :
neutron net-create –-provider:physical_network=physnet1 –-provider:network_type=flat <Network_Name>
neutron subnet-create <Network_Name> <CIDR> –name <Subnet_Name> –allocation-pool=<start_ip>, end=<end_ip>
neutron port-create <Network_Id>  –binding:vnic-type direct
And launch VM with port you have just created.
nova boot –flavor <Flavor_Id> –image <Image-id> –nic port-id=<Port_Id> <VM_Name>
We are seeking a competent software engineer to contribute to cutting-edge innovative developments in the frame of European research projects in the fields of IT and telecom.
Required qualifications:
Desired qualifications:
Interested? Send your CV to: vacancies@medianetlab.gr
The NFV-focused T-NOVA EC/FP7 research project, led by MNL, released its second specification document, proposing an integrated top-down NFV system architecture for the provision of Virtual Network Functions as-a-Service. The T-NOVA architecture reuses ETSI NFV concepts for the lower architectural layers, while it introduces novel entities, including an NFV Marketplace with the aim of accelerating the market uptake of the VFNaaS business case. The defined architecture is reasonably complex and feasible to realise, being compatible with existing state-of-the-art IT and network infrastructures and will be fully implemented in the course of the project.